

As of 2022 -after spending six years under Google Marketing Platform umbrella-, Looker Studio is now a part Google Cloud Platform with more than 700 connectors. Looker Studio is free, and has the same features as Data Studio.
Entry-Level: Basic knowledge of Google Analytics and digital marketing landscape will be advantageous.
Goals ⛳
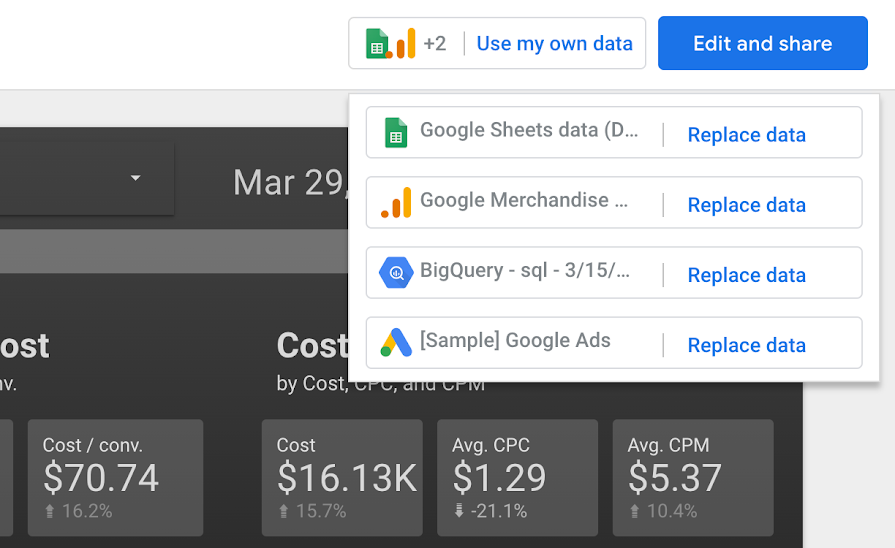
🎯 Working with data from Google Analytics, Google Sheets, BigQuery etc.
🎯 Creating powerful reports by visualizing your data
🎯 A step-by-step guide to quickly and confidently building dashboards
🎯 Sharing and collaborating on reports
🎯 Blending data from different sources
🎯 Creating calculated fields and parameters
🎯 Using action controls like drop downs, sliders and other filter controls
Content 📖
☁️ What is Looker Studio and what do they used for?
📡 Connect data and visualize from different data sources to visualize your needs
🔑 Key takeaways from clear data visualization graphics
📺 Contribution, sharing and scheduling options on Looker Studio
🎵 Bringing data from different tables together to create one report
📈 When and where to use action controls for best performance
⚠️ What causes reports and charts to break? Popular bugs, issues and limitations